After the previous three picoballoons did not turn on, we were really struggling to launch another. Was it worth it to build trackers, inflate balloons, and get up early to launch a balloon that never turned on? Luckily, we powered thru and launched another picoballoon on Saturday, Sept 4th, 2021, from our usual spot in the Berkeley Marina.
The team met at 9am, which is a bit later than usual. It was still very cloudy, so the actual launch didn't happen until 9:50am Pacific time (1650 UTC). The launch party was Martin W6MRR, Rob NZ6J, and Robert K6RGG.
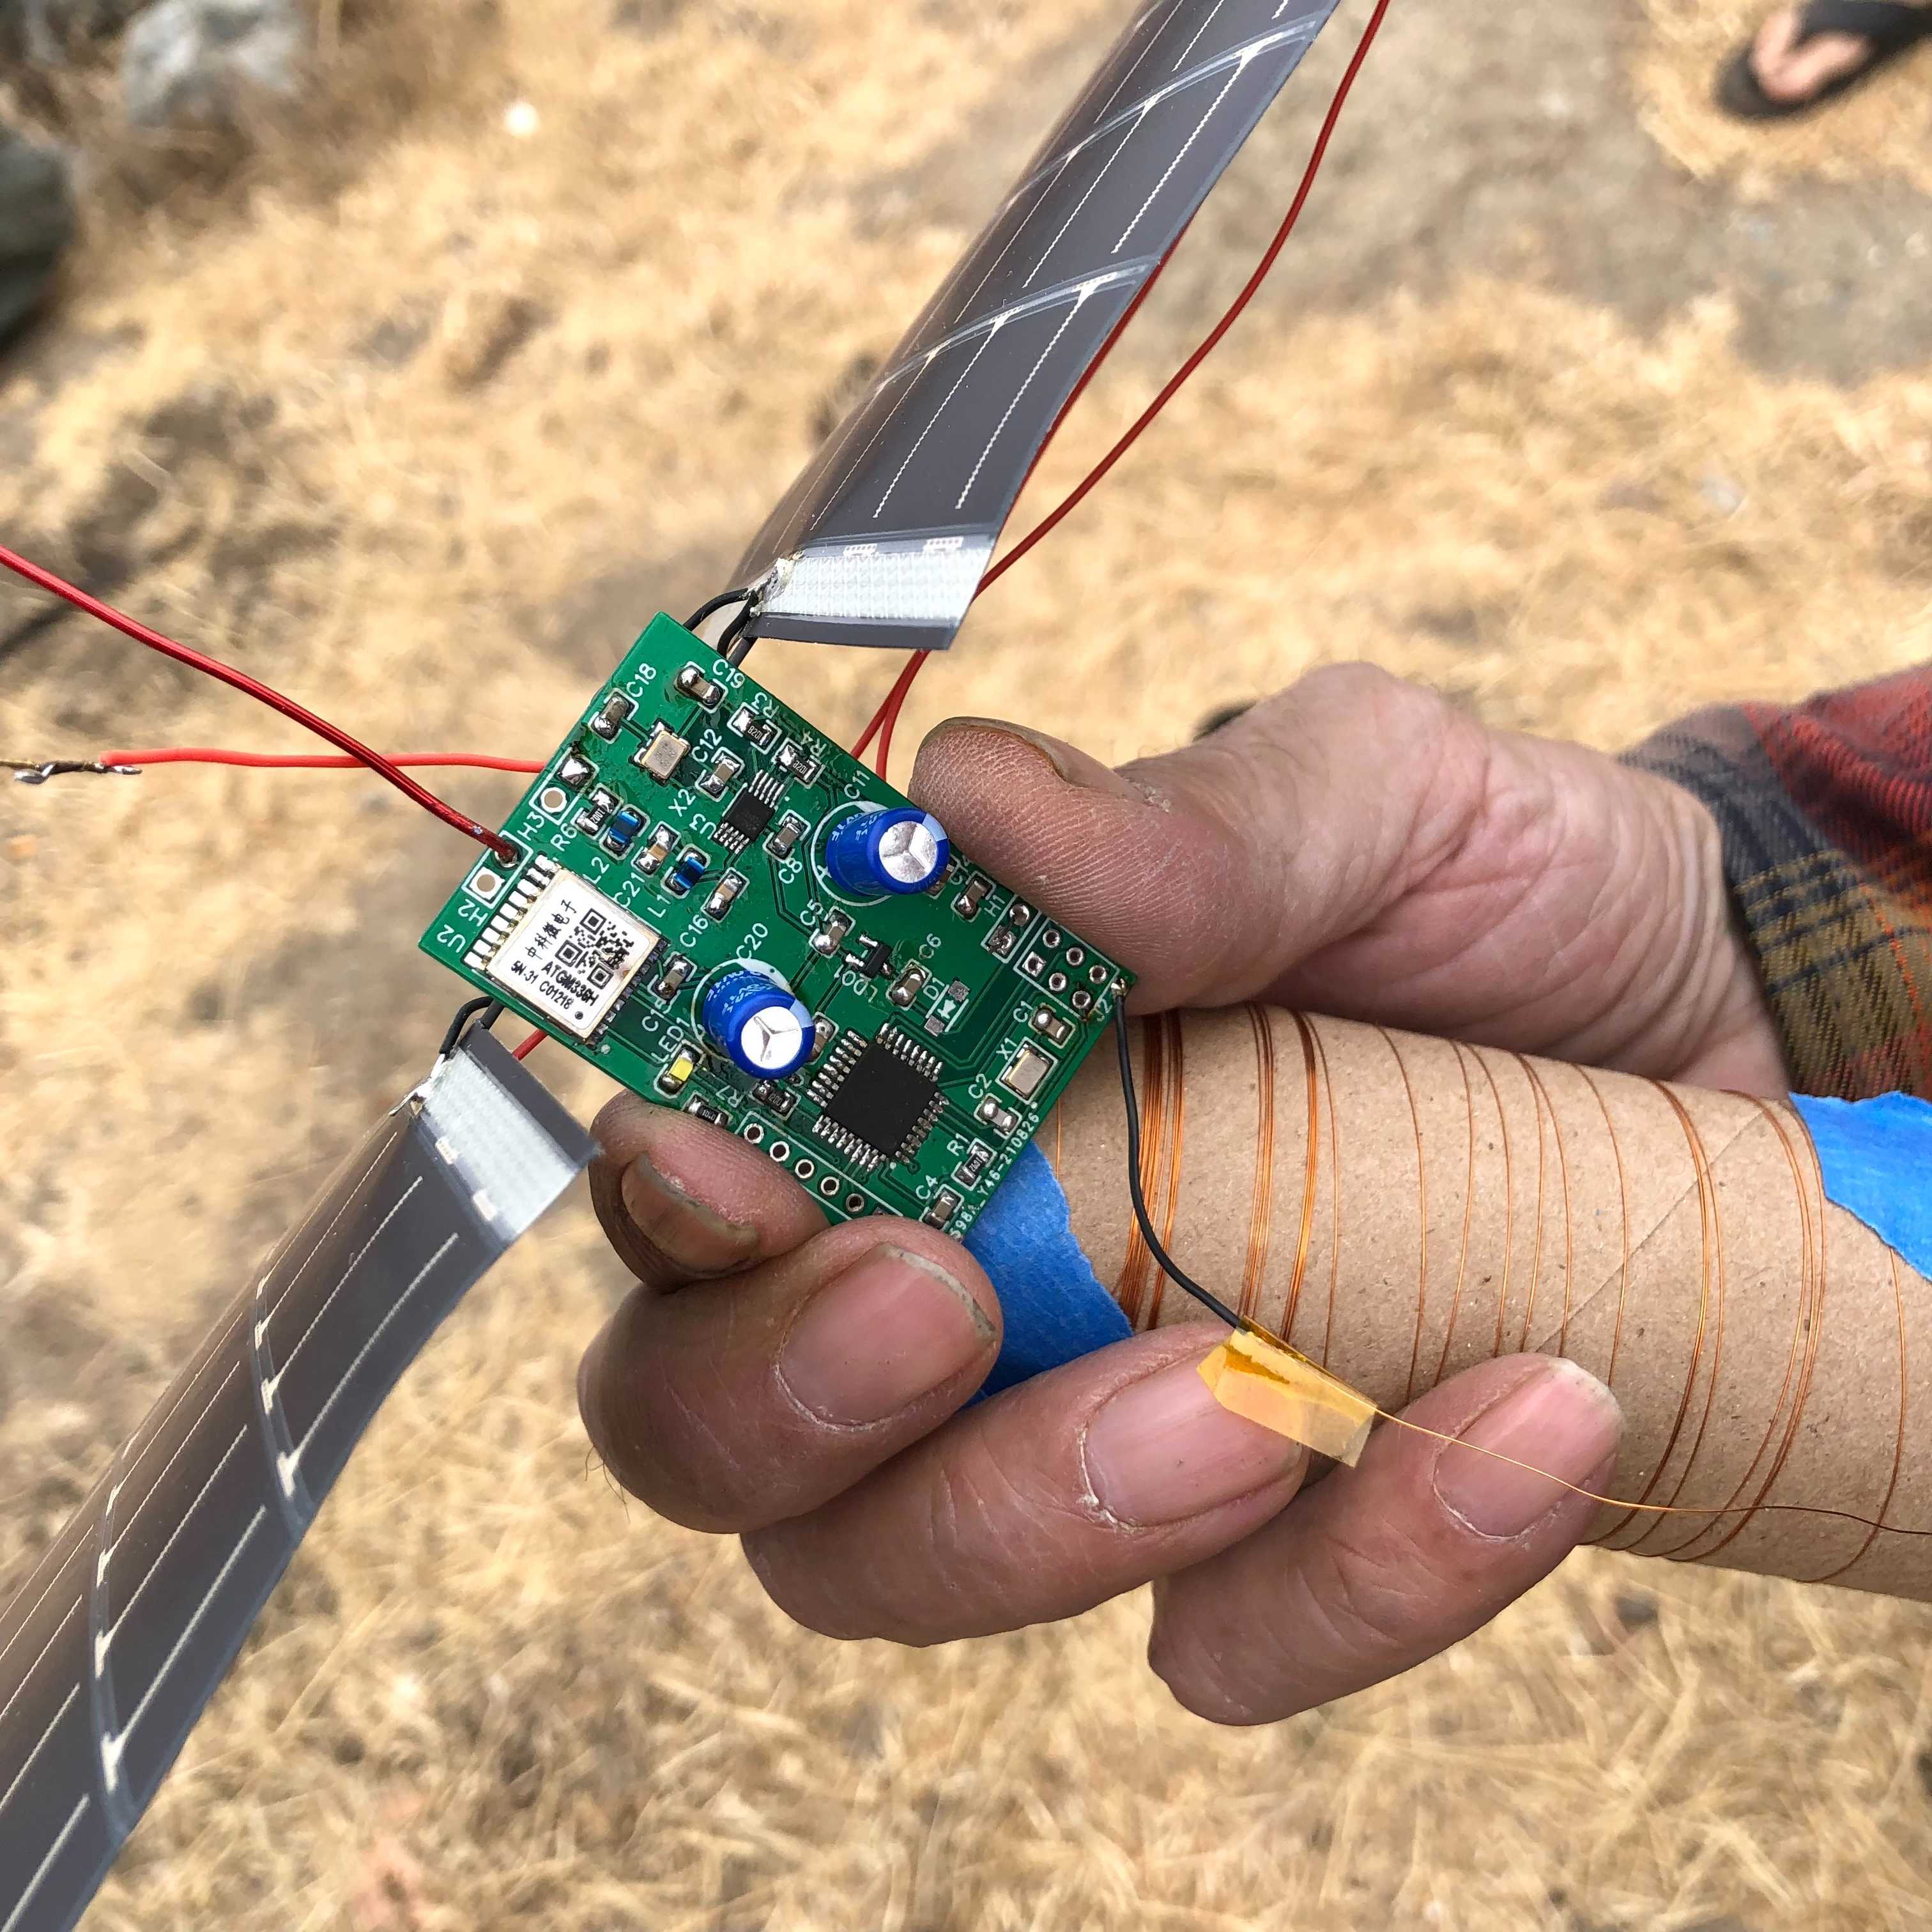

The tracker was released in full sunlight without getting wet in the bay.
Predictions
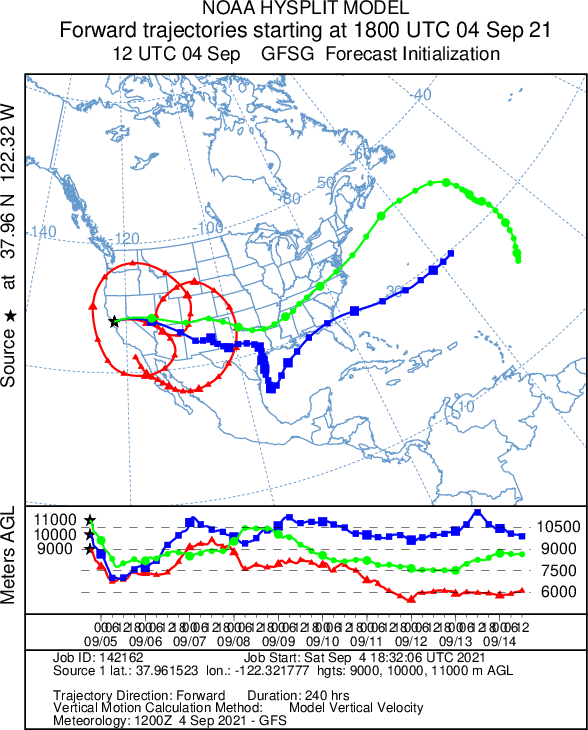
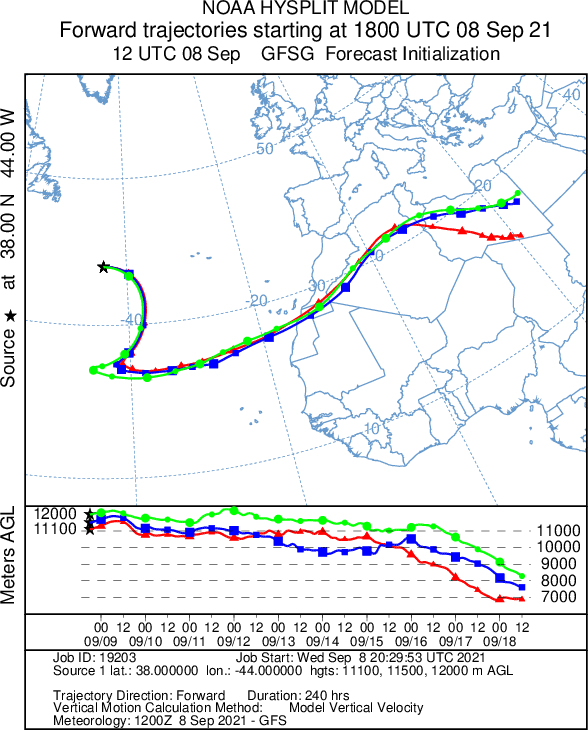
Running HYSPLIT predictions on the morning of the launch, the trajectory of the balloon was really dependent on what altitude the balloon finally reached. Lower altitudes, such as the red line at 9,000 meters, showed the balloon spinning in circles around the western United States. If we could reach 10,000 meters, the balloon had a good chance of reaching the Atlantic Ocean within 3 days. Each big dot is 24 hours, and each smaller dot is 6 hours.
For the WSPR protocol, which is what we're using to transmit picoballoon position, assumes that all transmitters are at ground level. The actual power output of WSPR transmitter on the balloon is a fixed +10dBm (10mW), into the vertical dipole, but we are encoding the altitude in the Power field, according to the following table:
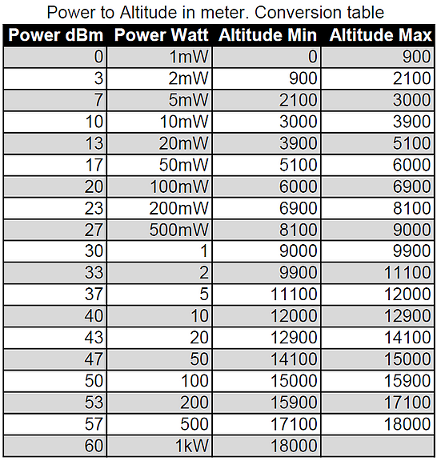
So a WSPR TX power level of +37dBm (5 watts) means the balloon is somewhere between 11,100 and 12,000 meters (36.4k and 39.4k feet). This altitude is above most of the weather, but still within the jetstream. This is our ideal float altitude.
Flight Results
This balloon started transmitting almost immediately after liftoff! Finally, after 3 failed launches, we had a successful one. The WSPR callsign is W6MRR, and using the WSPR to APRS bridge script, the APRS callsign is W6MRR-18.
The first packet was received only a few minutes after launch at 1656 UTC. The balloon reached above 11,100 meters altitude (5 watts of TX power) 202 minutes later at 2018 UTC, which meant the ascent rate was ~55 meters/minute or 0.91 meters/second. The balloon then coasted above 11,100 meters altitude until night fell at 2342 UTC.
The First Week: North America and Atlantic Ocean
Luckily for us and our quest to circumnavigate the world, the balloon was in the jet stream and headed for the East Coast at a pretty fast clip. We were even higher than the green line in the HYSPLIT prediction above.
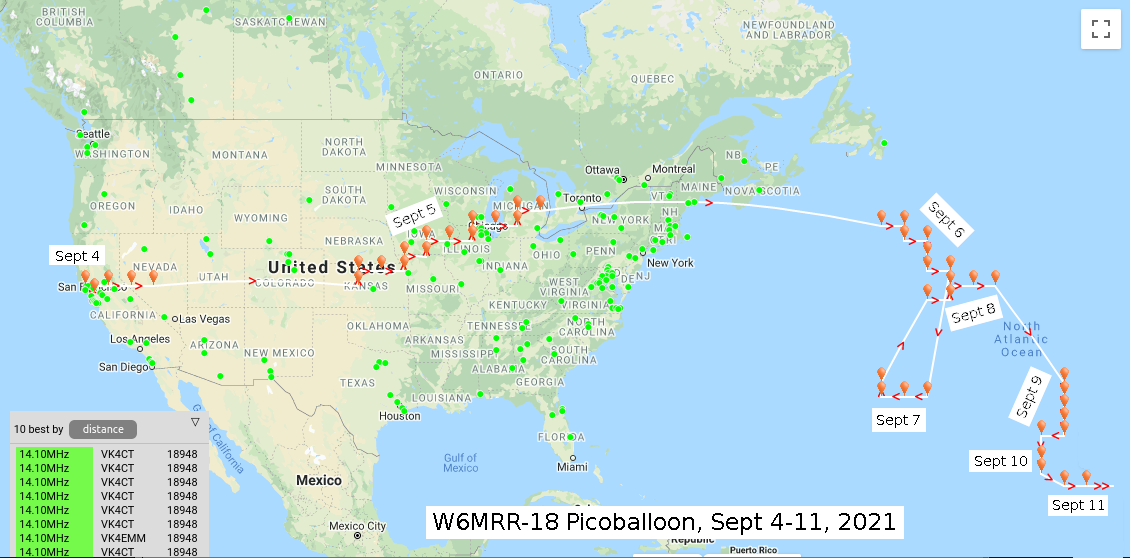
The balloon lost some altitude over the first night, floating somewhere between 9,900 and 11,100 meters, before waking up over Kansas on September 5th. It woke up at 1436 UTC (9:46am Central Time) and traveled 1460 km between EM08 and EN83 in just over 7 hours for an average speed of 207 km/hr (~130 mph). Wow that's pretty fast!
The night of September 5th was also pretty fast, from when the balloon went to sleep at 2140 UTC until it woke up on Sept 6th at 1126 UTC it traveled ~2450 km (from EN83 to GN32) at an average speed of ~178 kph (~110 MPH). This was the last speedy part of the voyage, as soon as the balloon reached the middle of the Atlantic Ocean the speed slowed down considerably.
Starting on September 6th, the balloon had risen back above 11,100 meters altitude, and it was circling the Atlantic. WSPR receive stations on both sides of the Atlantic picked up the balloon as it floated around, not really in a hurry.
On Sept 8th, after the balloon completed one loop in the middle of the Atlantic, I ran some predictions for the next 10 days. HYSPLIT showed that the balloon would head south, then towards Western Sahara, making landfall around Sept 13th. Each big dot is 24 hours, and each smaller dot is 12 hours.
The balloon followed pretty close to the lower-altitude predictions (red and blue lines above).
The furthest station that received our picoballoon was John Loftus VK4CT in Queensland, Australia, for a total distance of ~19,000 km. That's pretty good for a 10mW signal! All of the WSPR packets from the first week can be downloaded here.
The Second Week: Africa
After slowly circling the Atlantic Ocean, the balloon spent Sept 12th off the coast of Africa, and true to the Sept 8th prediction, crossed over Western Sahara into Algeria on Sept 13th. It did another loop around the southern part of Algeria, before crossing into Tunisia towards the end of Sept 16th.
Here is the aprs.fi map for this week:

Here is a pretty map of all the European WSPR spots for this second week, courtesy of Phil VK7JJ at wspr.rocks. Stations all across the globe received the balloon, with VK4CT in Australia as the furthest station at almost 19,000 km away. The positions on the map are slightly different between WSPR uses the center of the grid square, and the WSPR to APRS script uses the lower left corner.
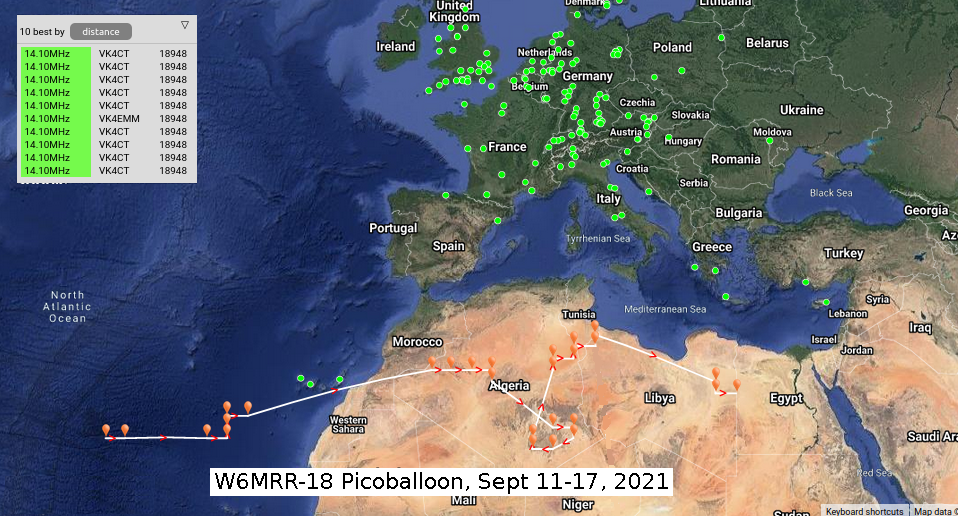
It's also interesting to see which countries have amateur radio operators contributing data to the WSPR network. Are there no hams in Ireland or Portugal listening to WSPR? Or are there a legal prohibition on doing this? This is why picoballoons have transitioned to long-distance HF frequencies from short-distance VHF APRS, so they are less dependent on a dense network of local receiver stations for position information.
All of the WSPR packets from the second week can be downloaded here.
Analysis
I collected the data for the first two weeks from this balloon, and here is some analysis on the flight so far. The balloon is still in the air and still transmitting, so expect another update in a few weeks.
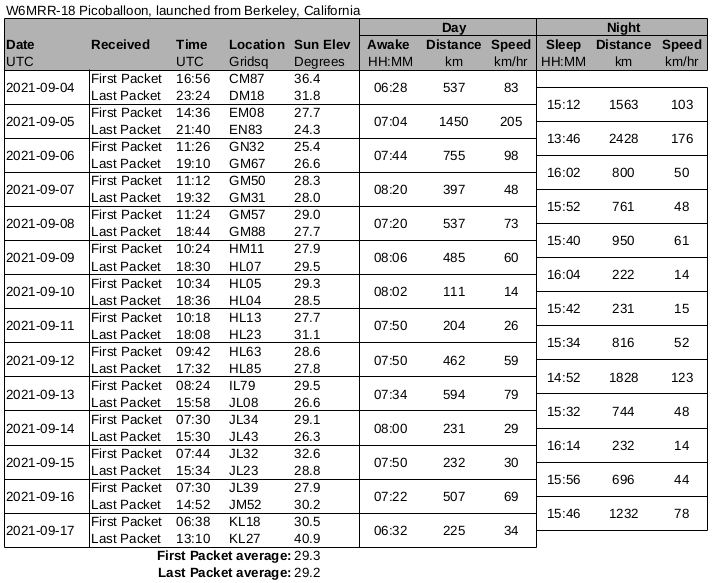
The fastest speed that the picoballoon attained was 205 km/hr (~127 MPH) during the Sept 5th daytime. I guess it really wanted spend some time at the beach! Once it got to Africa, speeds dropped considerably. The slowest period of time was the night of Sept 9th, where it only traveled 222 km at night and 111 km during the day, for an average speed of 14 km/hr over this ~24 hour period.
One of the other data points I was really interested in was sun angles. The tracker is entirely powered from two solar panels, there are no batteries onboard. Two ultracapacitors help keep the electronics running when the WSPR transmitter is going, as the current draw when transmitting is just a little more than the panels can produce. At what sun elevation does the tracker power on in the morning, and when does the sun get too low where the solar cells don't collect enough power to keep the tracker running?
With only two weeks of data, I found that the tracker turns on when the sun rises above 29.3 degrees, and turns off when the sun falls below 29.2 degrees. I thought that charging up the ultracap would take some time, but at mid-latitudes during this time of the year the sun rises 0.1 degrees in about 30 seconds. So it's safe to assume that charging of the ultracaps does not take a long time at all.
This sun angle also assumes the balloon is on the ground, which I think is a safe assumption given how far the sun is away from the earth.
Future Trajectory Forecast
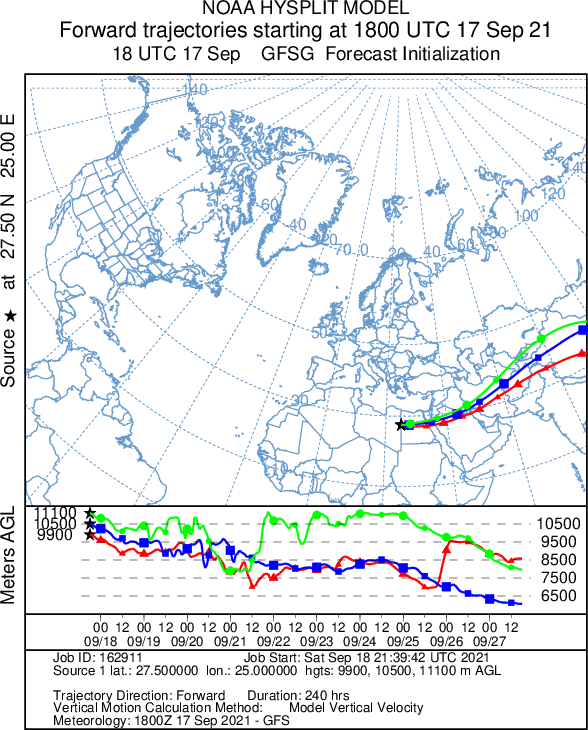
At the end of the second week, this picoballoon is still in the air and transmitting. Looking towards the third week, HYSPLIT predicts the balloon will head east rather quickly, and pass north of the Himalayas on Sept 20th. There seems to be a bug in HYSPLIT that doesn't show the ground track past Sept 20th, even though it has the pressure data for the full 10-day forecast.
Hopefully the balloon will stay afloat long enough to circumnavigate the world!
Code
I used PyEphem to calculate the sun elevations. I also used PyHamTools from DH1TW to convert the Maidenhead grid squares into lat/long for PyEphem.
Using Python 3.8.10 with Ephem 4.0.0.2 and PyHamTools 0.7.7.
#!/usr/bin/env python
# coding: utf-8

from pyhamtools.locator import locator_to_latlong
import ephem
import math
import datetime

# Create bal_pos object, which is the balloon
bal_pos = ephem.Observer()

bal_pos.date = input("Enter UTC time: YYYY-MM-DD HH:MM:SS : ")

# PyEphem needs lat/long. locator_to_latlong converts gridsquare to lat/long tuple
latlong = locator_to_latlong(input("Enter Gridsquare: "))

# PyEphem needs string input for lat/long
bal_pos.lat = str(latlong[0])
bal_pos.lon = str(latlong[1])

# print Observer information, just to double check
print(bal_pos)

# Instantiate the Sun and calculate sun angle at lat/long
# sun.alt is Apparent Altitude above horizon (elevation)
sun = ephem.Sun()
sun.compute(bal_pos)
sun_angle = float(sun.alt) * 57.2957795 # Convert Radians to degrees
print("sun_angle: %0.1f" % sun_angle)