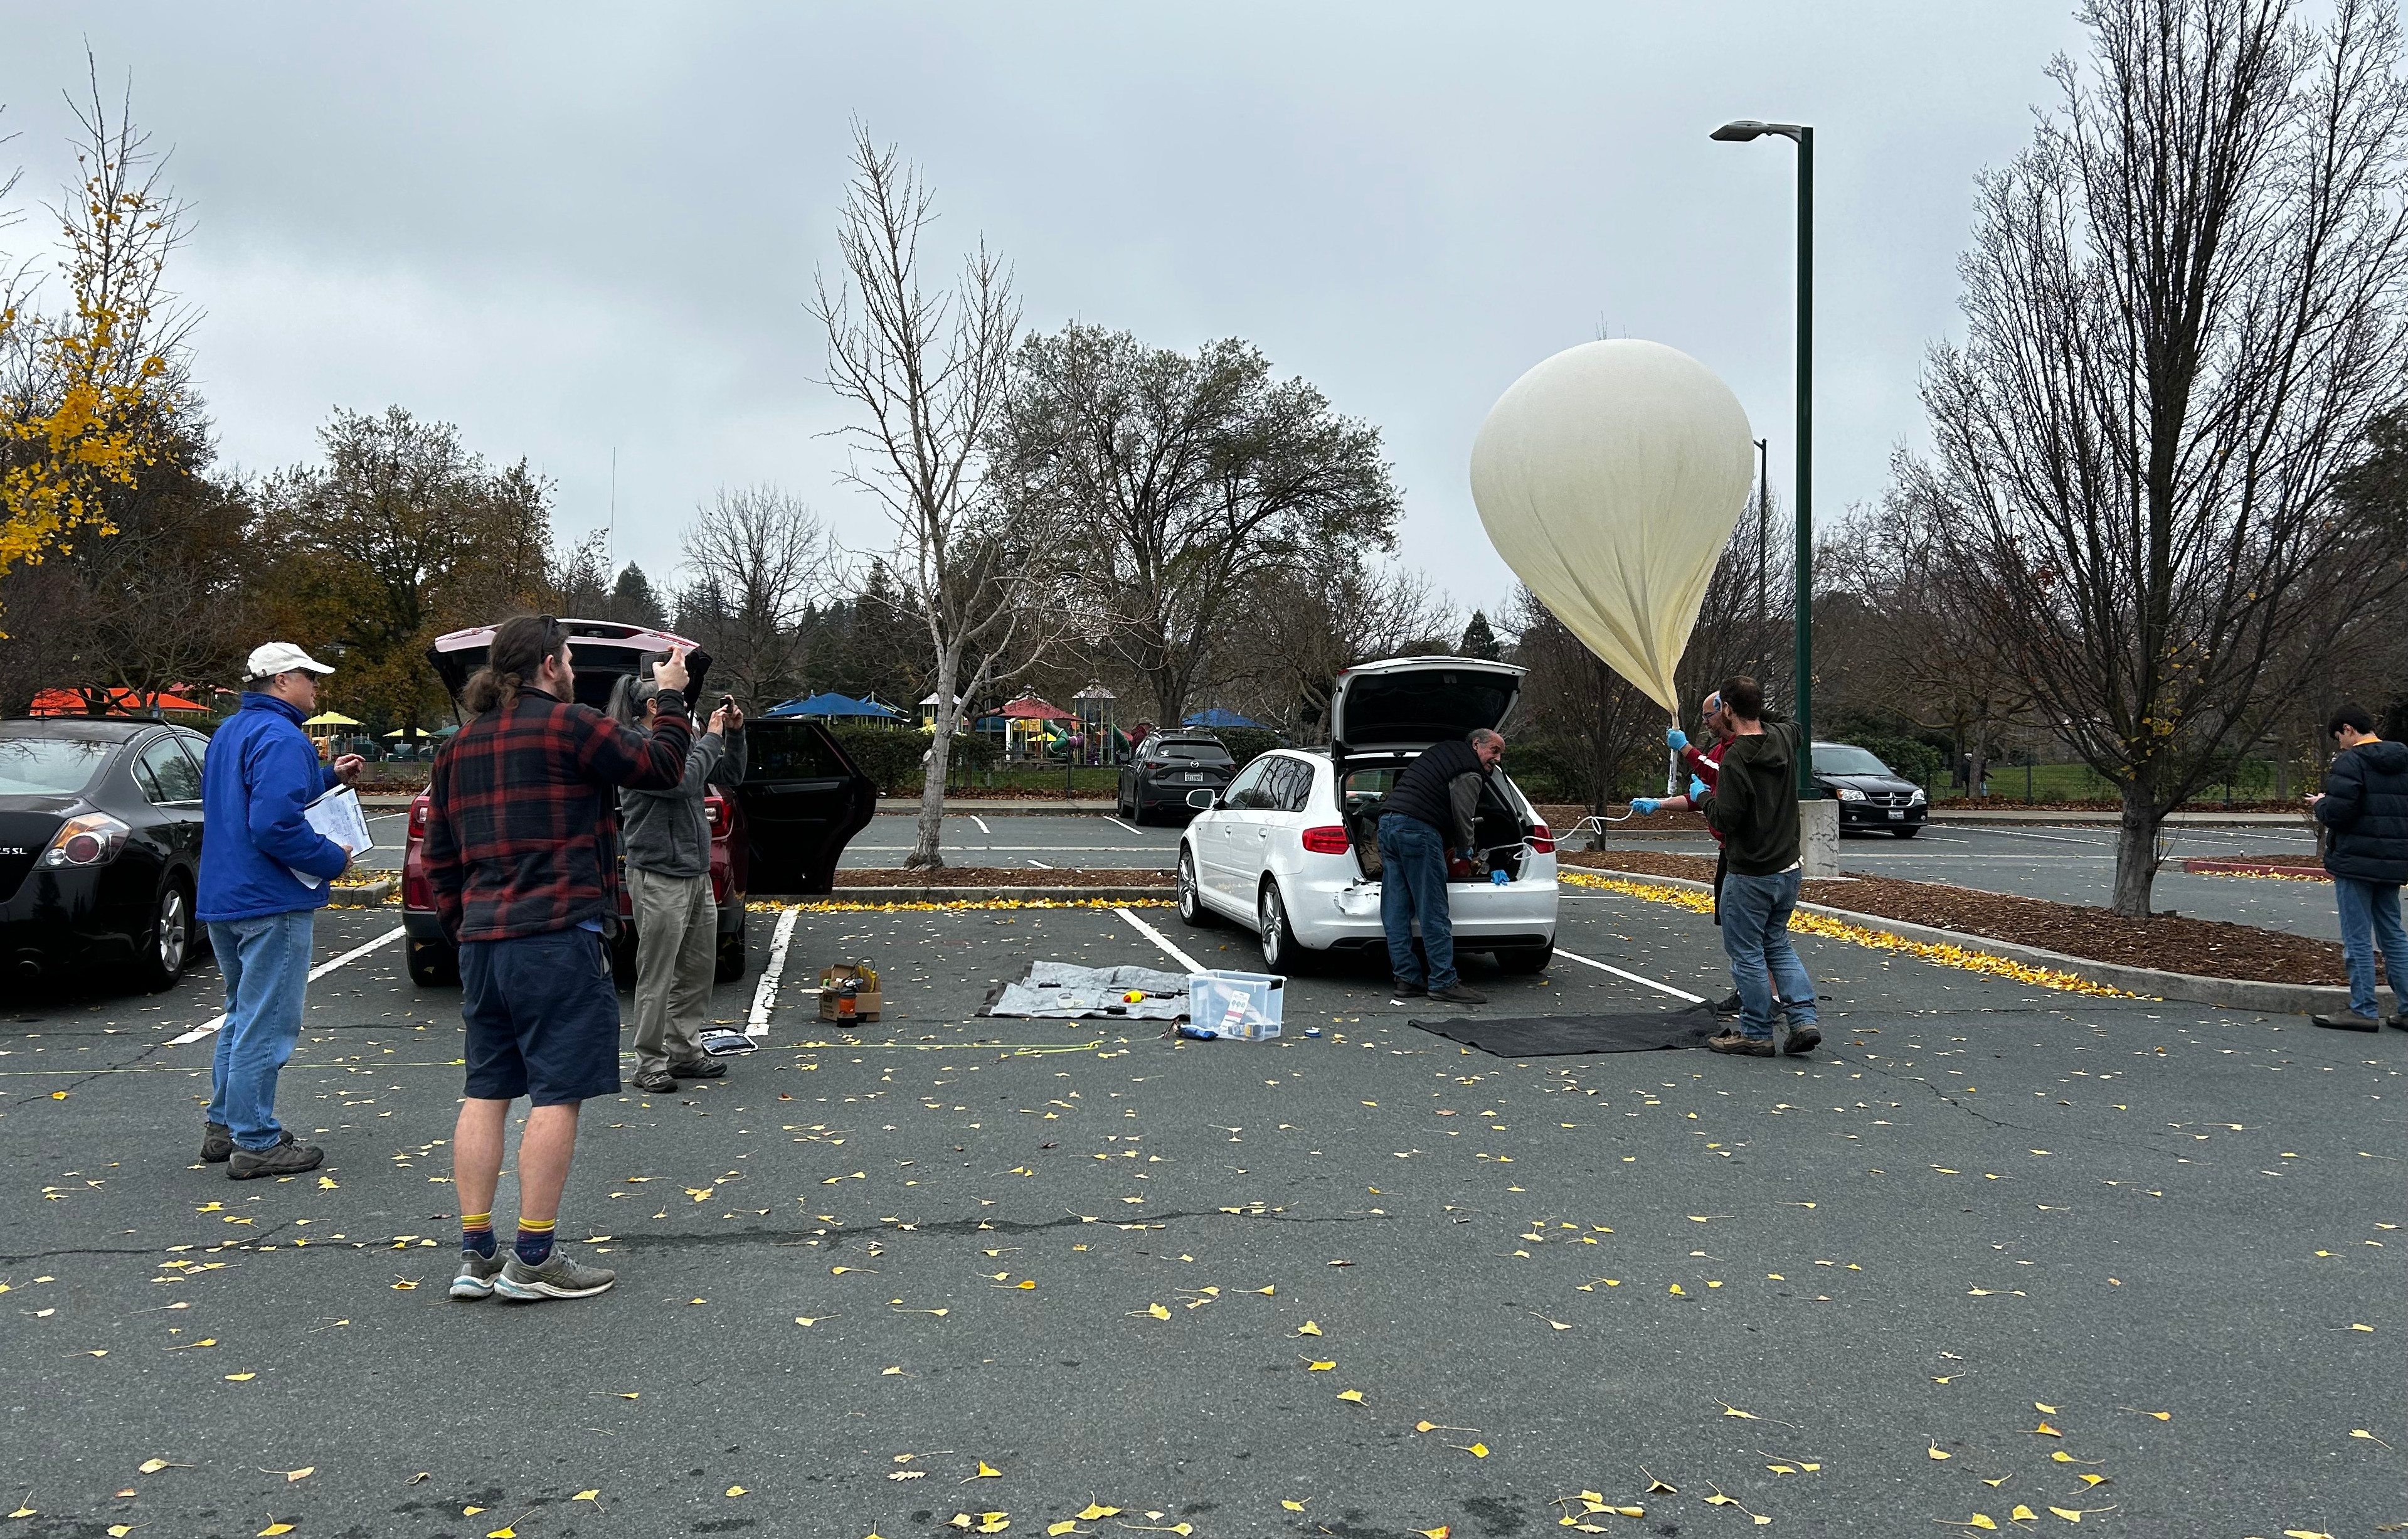
The SF-HAB group got together on Sunday 8 Feb 2025 and flew a bursting high-altitude balloon. This was a quick follow-on to Launch 3, which happened just before Christmas 2024.
Preflight Planning Meeting
The team got together on Zoom before the launch, to discuss what payloads we wanted to fly and find available dates. We targeted a Jan 25th launch. However, the weather wasn't looking good, and also that weekend was Winter Field Day, so it was decided to push the launch back by a two weeks.
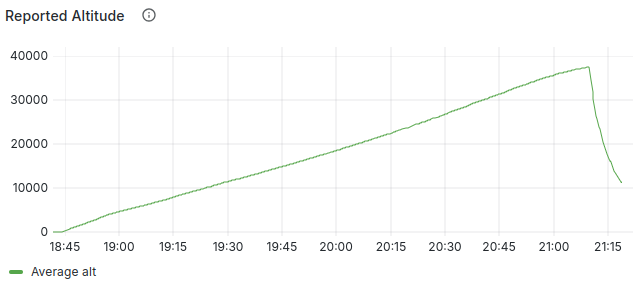
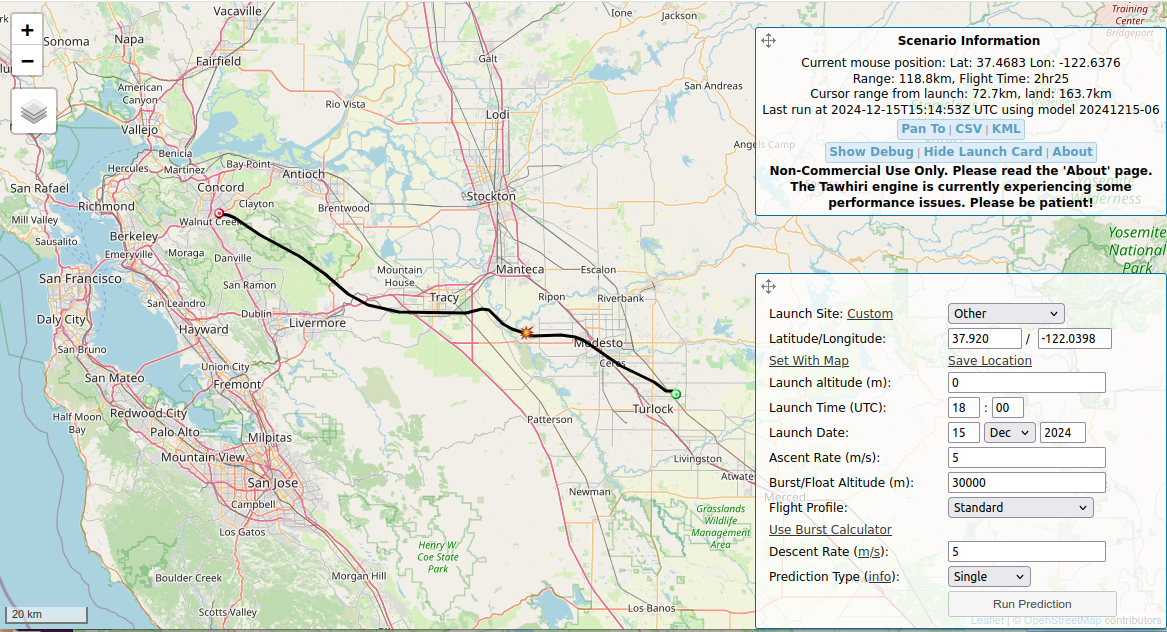
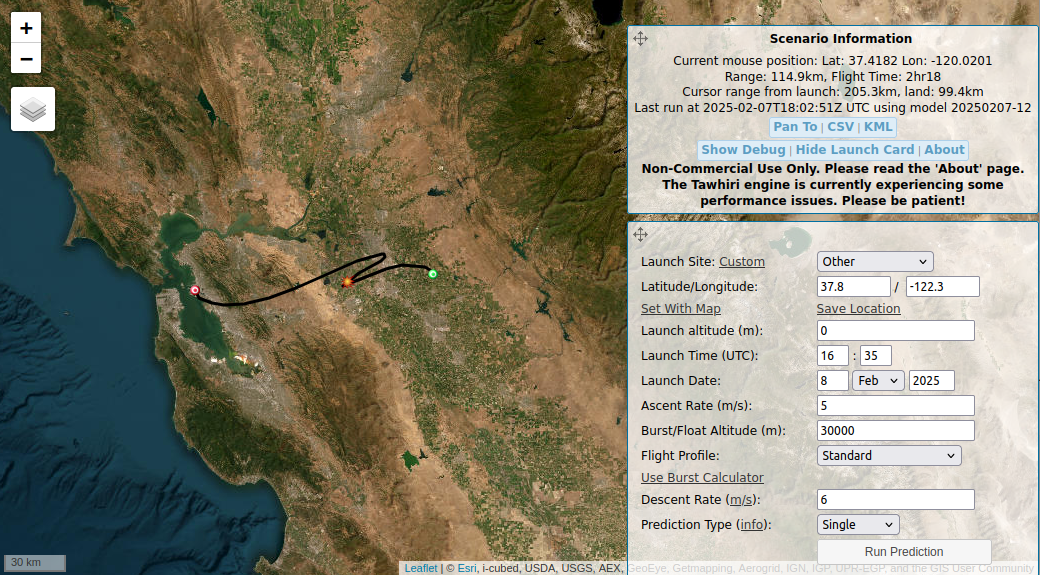
The week before the launch I kept running flight predictions for Sat Feb 8th. The early week predictions weren't good, but by Thursday the upper-atmosphere winds had slowed considerably and the predictions showed the balloon landing about 12 miles east of Stockton. Not great, but not bad either. We decided to launch.
We flew seven payloads on this flight. From the balloon (top) end:
- Parachute
- Two 900 MHz Meshtastic Nodes
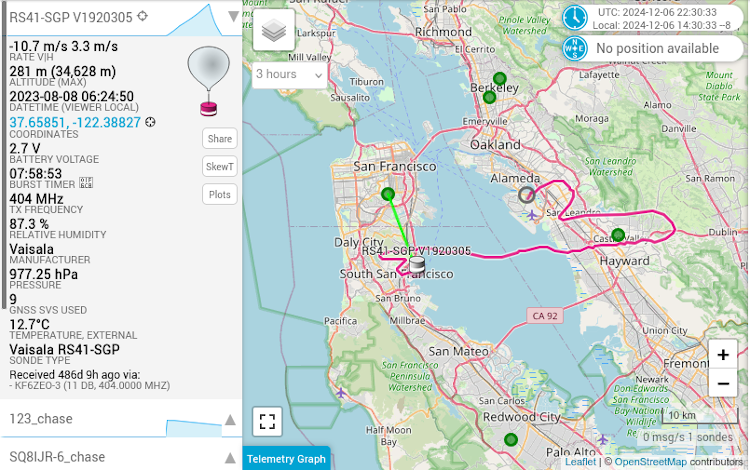
- 431.05 MHz Reprogrammed Vaisala RS41 Radiosonde
- 433.775 MHz LoRa Tracker
- 144.39 MHz APRS Tracker
- GoPro Camera
- VHF/UHF Cross-band Repeater ...